

Visualization of Air Pollution app for iPhone and iPad
4.8 (
368 ratings )
Education
Developer: Sebit, LLC
1.99 USD
Current version: 1.0, last update: 6 years agoFirst release : 14 Dec 2017
App size: 4.21 Mb
Go beyond the standard textbooks and take learning to the next level. Take part in scientific explorations, interactive exercises—and do it all right there on your device!
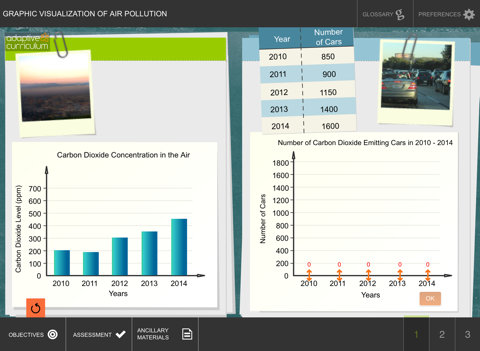
Discover how graphs are used in science. Draw graphs and study trends. Learn how graphical data can be used to support conclusions.
• Draw bar graphs.
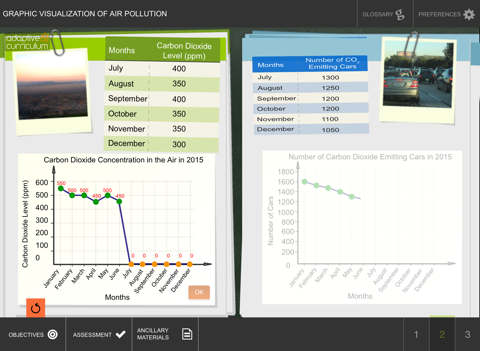
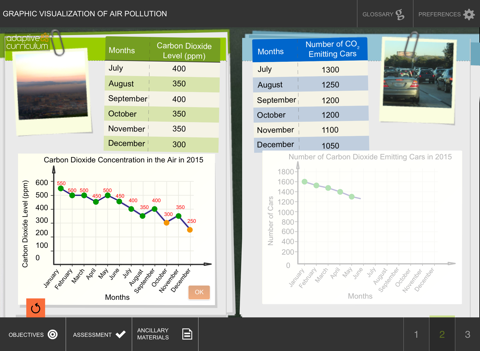
• Draw line graphs.
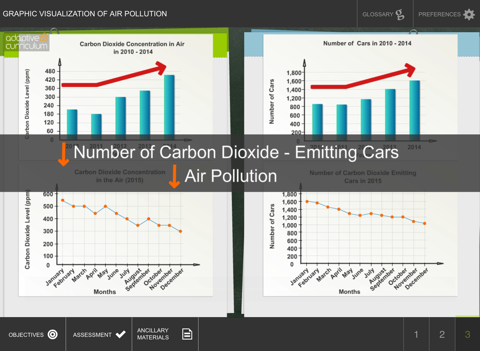
• Identify trends in graphical data.
App features:
• Discover how graphs can be used to determine trends.
• Draw bar and line graphs.
• Watch animations that explain the concepts.
• Test your knowledge with interactive tasks and quizzes.
• Want more? Check out the AC library in the App Store.